Disclaimer: This project website has been created for a university course. It contains partial and unpublished data that should not be used for any other purposes.
Data collected
Tables 2 and 3 below displays the type of data collected at each sampling site. Each row represents a sampling site (100m length of stream) with the data recorded on the date of that sampling event. The predictor variables for this study were the observed habitat characteristics of the stream that are used as criteria and thresholds to identify suitable grayling habitat. These include water temperature, slope, elevation, stream width, depth and velocity along with habitat types, substrate, riparian vegetation and the availability of cover for fish. The response variable measured was the presence or absence of Arctic Grayling at the site.
Tables 2 and 3 below displays the type of data collected at each sampling site. Each row represents a sampling site (100m length of stream) with the data recorded on the date of that sampling event. The predictor variables for this study were the observed habitat characteristics of the stream that are used as criteria and thresholds to identify suitable grayling habitat. These include water temperature, slope, elevation, stream width, depth and velocity along with habitat types, substrate, riparian vegetation and the availability of cover for fish. The response variable measured was the presence or absence of Arctic Grayling at the site.
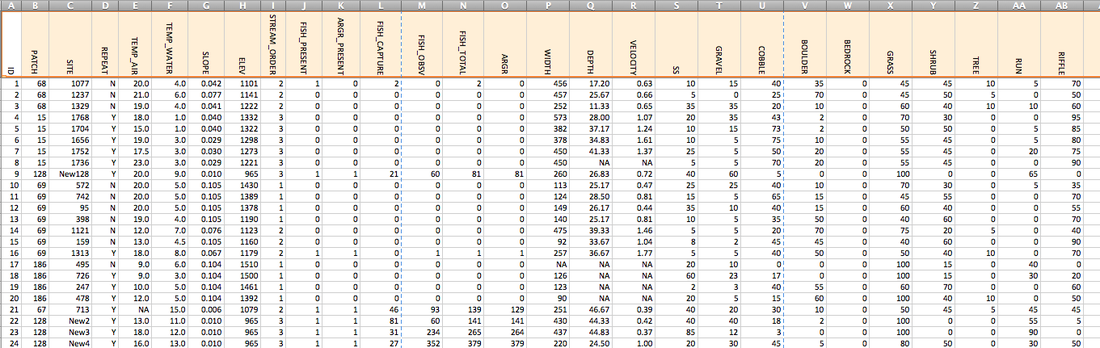
Table 2. A table showing an example of the data collected at each sampling site that was used for analysis.
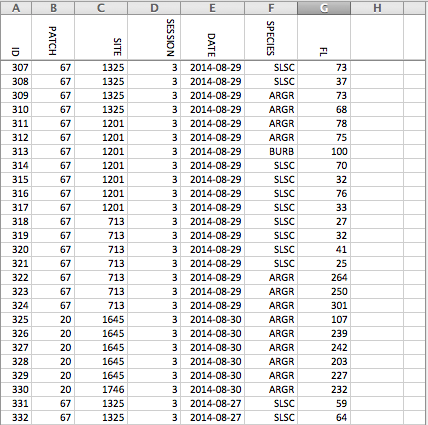
Table 3. An example of the data recorded on fish captured at each site, which included location, species, fork length and a genetic identifier if tissue was collected.
Exploratory graphics
The raw data was tested for errors using a variety of tools available through R Programming Software. The data was displayed graphically for an initial diagnosis of relationships, variability, distribution and outliers. Scatter plots and histograms were used to review the numerical variables associated with the physical characteristics of the sites (i.e. slope, elevation, temperature, velocity, depth and width). Histograms and box plots of each variable were used to check shape and distribution of the compositional data collected for physical characteristics of the stream (i.e. substrate, riparian vegetation and habitat type).
Summary statistics, including mean, median, standard deviation and range were calculated for each variable to get a sense of the spread in the data. A Shapiro test was also run to look at probability of normality. Figures 5, 6 and 7 show, graphically, what some of the data collected looked like.
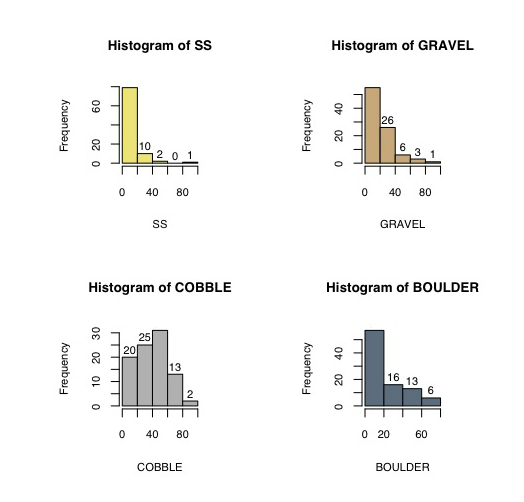
Figure 5. Histograms of the data on four categories of substrate evaluated for composition (% out of 100) at each site sampled in Period 1.
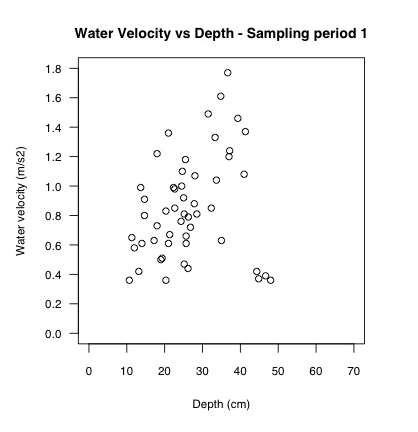
Figure 6. Graph showing the raw data for water velocity and depths taken at all sites sampled in Period 1.
|
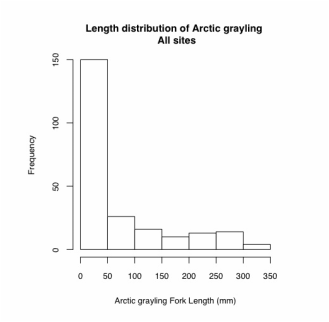
Figure 7. Graph showing length-frequency distribution for Arctic Grayling captured in Sampling Period 1.
|
None of the data collected on fish or habitat was normally distributed. Transformations were attempted to see if the data could be normalized for parametric statistical analysis, but without success. The type of ecological data collected and the knowledge gaps being explored in this study focus on understanding and establishing relationships between biophysical characteristics of a stream and the presence of Arctic Grayling. Non-parametric and binomial statistical methods, which do not assume normality, were determined to be more appropriate analysis for the data collected and the questions being addressed in this study.
There were discrpencies in the data collection and sample sizes between Sampling Periods 1, 2 and 3. Instantaneous water temperature and velocity were not recorded in Sampling Period 2 and there was a small sample size in Sampling Period 3 which limited the types of analysis that could be conducted on the entire data set, as well as between sampling periods.
