Disclaimer: This project website has been created for a university course. It contains partial and unpublished data that should not be used for any other purposes.
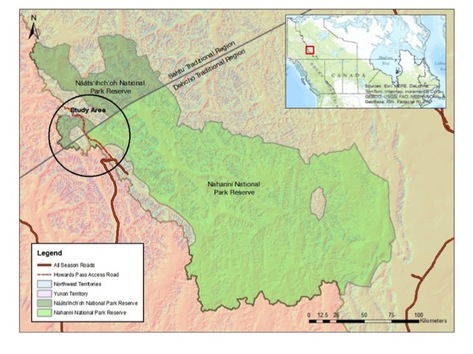 Figure 2. Map showing the location of the Nahanni and Naats'ihch'oh National Parks in the southwest of the Northwest Territories, bordering the Yukon. The Little Nahanni River watershed study area is identified in the upper left. The mine road identified in red follows the river valley as it flows north until it meets the South Nahanni River.
Study Area
The study area is located in the Little Nahanni River watershed in the southwest of the Northwest Territories, bordering the Yukon and centred at approximately 512170 m E, 6897916 m N (UTM). The watershed spans both the Nahanni and the Naats’ihch’oh National Parks (Figure 2).
There are limited records documenting fish presence in the Little Nahanni River watershed. The majority of the streams in the watershed were unsurveyed prior to this study, with no information available on potential fish or fish habitat.
Sampling was conducted over 3 sampling periods: 1) June 25-July 4; 2) July 27-August 4; and 3) August 25-31, 2014.
Study design
The sampling design for the Little Nahanni River study used a distributional monitoring approach based on a protocol developed by Isaak et al. (2009) to monitor bull trout in the northwestern United States.
Selecting streams
Streams possessing potentially suitable habitat for spawning and rearing of Arctic grayling were identified in the Little Nahanni River watershed. Suitable streams or habitat patches were selected using pre-determined environmental criteria. For this study, these criteria were the stream catchment area of > 400ha (water exists), a stream grade of < 15%, a stream Strahler Order < 4 and an elevation <1500m.
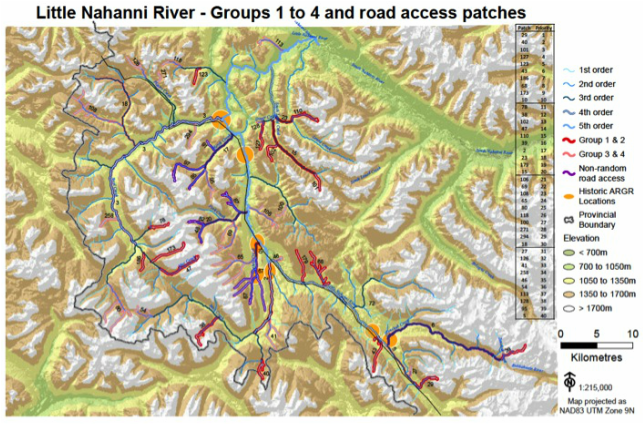
Figure 3. Map of the Little Nahanni River watershed showing the top 40 habitat patches identified for distributional monitoring of Arctic grayling.
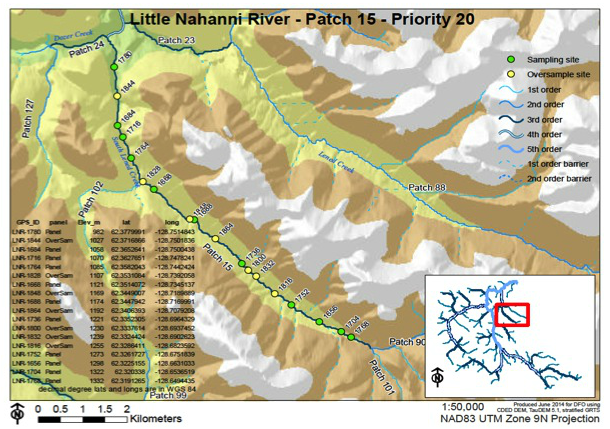 Figure 4. Map of a selected habitat patch (stream) showing the locations of randomly selected sample sites.
Selecting sampling sites
Sampling sites (100m in length) were identified within each habitat patch using GIS and a Generalized Random Tessellation Stratified design (GRTS; Stevens and Olsen 2004). GRTS uses a randomized-hierarchical grid that arrays sites throughout a stream network to achieve spatial representation. Therefore, the number of sampling sites per patch correlated to the length of the stream, with an average of approximately 8 sites per patch (stream).
Sampling methods
Each site was 100m in length and was sampled for fish presence (occupancy) using a single-pass electrofishing survey moving from downstream to upstream. Fish captured during the surveys were identified and fork length recorded. Genetic samples (fin clips) were collected on fish greater than 50mm in length.
Each site was 100m in length and was sampled for fish presence (occupancy) using a single-pass electrofishing survey moving from downstream to upstream. Fish captured during the surveys were identified and fork length recorded. Genetic samples (fin clips) were collected on fish greater than 50mm in length.
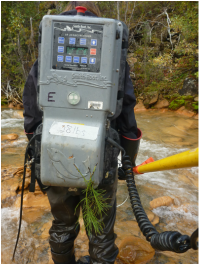
Photo 2. A Smith Root LR-24 electrofishing unit used to survey sites for fish presence.
|
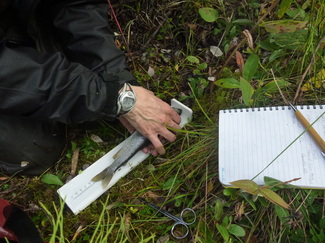 Photo 3. Measuring the fork length on a juvenile Arctic Grayling captured while sampling a site. The small nub-like adipose fin located along it's back is clipped to both mark the fish for identification in recapture and to collect a tissue sample for genetic analysis. Photo 3. Measuring the fork length on a juvenile Arctic Grayling captured while sampling a site. The small nub-like adipose fin located along it's back is clipped to both mark the fish for identification in recapture and to collect a tissue sample for genetic analysis.
|
At each sampling site, one transect (stream bank to stream bank, perpendicular to the flow) was selected to record habitat data. Evaluating the habitat present at each site provides important observational information needed to delineate suitable habitat patches, determine habitat availability and identify which stream resources or conditions may be selected more often than others (Manly et al. 2002). Table 1. below outlines the habitat data that was recorded to characterize stream habitats at each 100m site, using methods from Isaak et al. 2009 and Environment Canada 2012 sampling protocols.
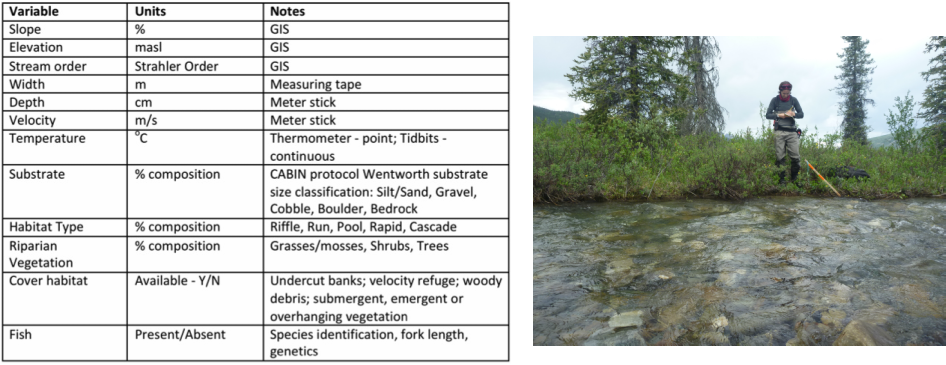 Table 1. A list of the variables collected from each sampling site in 2014. Photo 4. Recording habitat characteristics at a sampling site on Guthrie Creek.
Photo documentation of upstream, downstream, left and right banks as well as substrate were taken to record the conditions at each site.
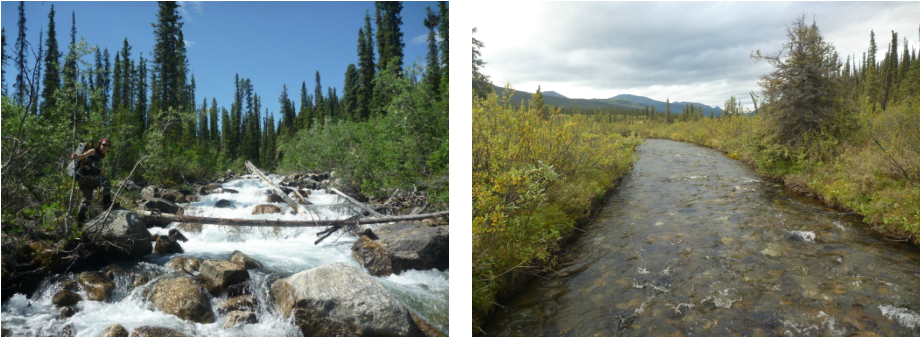
Photos 5 and 6. An example of the different habitat conditions available within one creek system. The photo on the left was taken in June in a second order tributary of Guthrie Creek and the photo on the right shows the conditions in the main channel of Guthrie Creek in August.
Water temperature loggers (Onset HOBO® Tidbits), which are able to continuously monitor water temperatures over time, were installed in suitable locations in the upper, mid and lower reaches of streams using a standardized protocol developed by Isaak et al. 2013 for deployment. The loggers were programmed to record water temperatures at 1-hour intervals.
Sampling sites were repeat surveyed for fish presence only, within the same sampling period, to allow for more accurate estimation of occupancy and detection efficiency (reducing false absences or a Type II error in sampling).
Sites that did not have adequate water for suitable fish habitat or had barriers to fish passage were recorded. This information was used to eliminate sites from future surveys.
Statistical Analysis
The data collected for each variable was evaluated using exploratory graphics and descriptive statistics to look at the distribution, spread and any errors or outliers in the recorded values.
A multiple-logistic regression analysis based on a logit model was used to identify relationships between the habitat (predictor) variables and the presence or absence of Arctic Grayling (binomial response variable). Using these relationships, probabilities were developed for predicting Arctic Grayling presence. Logistic regressions were run and plotted on each individual habitat variable to evaluate the strength of the potential relationship, it's influence on the response and to identify those variables that may be best suited for inclusion in a logistic model. Multiple logistic regressions were then completed using different combinations of habitat variables to select a model that best fit the data.
A binomial ANOVA was run on the outputs of the models to evaluate the variance and further confirm the significance of the selected predictor variables. The predicted probabilities of Arctic Grayling presence from the model outputs were plotted against the most significant variable influencing the model results. The relationship between the strongest habitat variable and the predicted occurrence of Arctic Grayling can be used to establish thresholds related to the predicted occurrence of the species. The results from Akaike's Information Criteria (AIC) and Area Under the Curve (AUC) were used as performance measures to evaluate and select the best fit model for the analysis.
